PAN-AQI: A Panoramic Dataset and Framework for Urban Air Quality Estimation

SPCRC & CVIT, International Institute of Information Technology, Hyderabad

Abstract

Scalable Air Quality Monitoring from Panoramic Vision

Image-based air quality estimation offers a scalable alternative to sparse sensor-based monitoring. However, existing methods rely on narrow field-of-view imagery and overlook both the spatial structure of panoramic scenes and the ordinal nature of Air Quality Index prediction. To address these limitations, PAN-AQI introduces a large-scale dataset comprising 33,982 panoramic 360° street-view images collected over 1,000 km across the twin cities of Hyderabad and Secunderabad, India, with co-located PM2.5, PM10, temperature, and humidity measurements. The paper further proposes PANQIFormer, a multimodal transformer framework that jointly models panoramic visual context and environmental metadata for AQI estimation. The architecture combines spatial-zone reasoning, attention-based multimodal fusion, and ordinal-aware learning to perform both AQI category classification and continuous AQI regression. Experiments demonstrate consistent improvements over previous image-based AQI methods across both tasks, while ablation studies show that panoramic coverage, spatial reasoning, and multimodal fusion each contribute substantially to performance.

Introduction

Why Full-Panorama AQI Estimation Matters

The paper frames PAN-AQI around a practical monitoring gap: reference stations are sparse, low-cost sensors drift under changing weather, and narrow-angle imagery misses much of the atmospheric context visible in a full 360-degree scene.

Problem Setting

Air pollution remains a major public-health concern, and AQI provides a standardised 0-500 scale for communicating air quality. In the Hyderabad-Secunderabad corridor, the paper notes both a heavy PM2.5 burden and limited reference-station coverage, which makes spatially dense monitoring difficult.

Imagery is attractive because it directly captures haze, sky discoloration, and exhaust plumes, but prior work typically relies on rectilinear front-facing views that cover only a narrow azimuth and ignore the rest of the scene.
Gaps Identified

  • Single-view images fail to preserve the full panoramic atmosphere surrounding the vehicle.
  • Most prior AQI models treat band prediction as an unordered classification task, despite the ordinal nature of AQI categories.
  • No public panoramic AQI dataset was available before PAN-AQI.

The paper is organised to address these gaps in order: dataset design, multimodal architecture, experimental validation, and concluding directions.

Key Contributions

What PAN-AQI Adds to the Literature

These points are distilled directly from the paper’s abstract, introduction, methodology, and results, and they frame the rest of the page for a reviewer-oriented read.

1

PAN-AQI Dataset

The paper introduces a 33,982-sample panoramic dataset collected over roughly 1,000 km in Hyderabad and Secunderabad, with co-located PM2.5, PM10, temperature, and humidity readings.

2

PANQIFormer Architecture

PANQIFormer jointly models panoramic visual context and environmental metadata through spatial-zone representation, multimodal fusion, and ordinal-aware prediction heads.

3

Comprehensive Evaluation

Experiments show 88.9% accuracy, 87.3% macro F1, and 10.45 MAE, with 97.4% agreement between regression and classification heads and ablations supporting the value of panorama, spatial reasoning, and multimodal fusion.

Dataset

The PAN-AQI Dataset

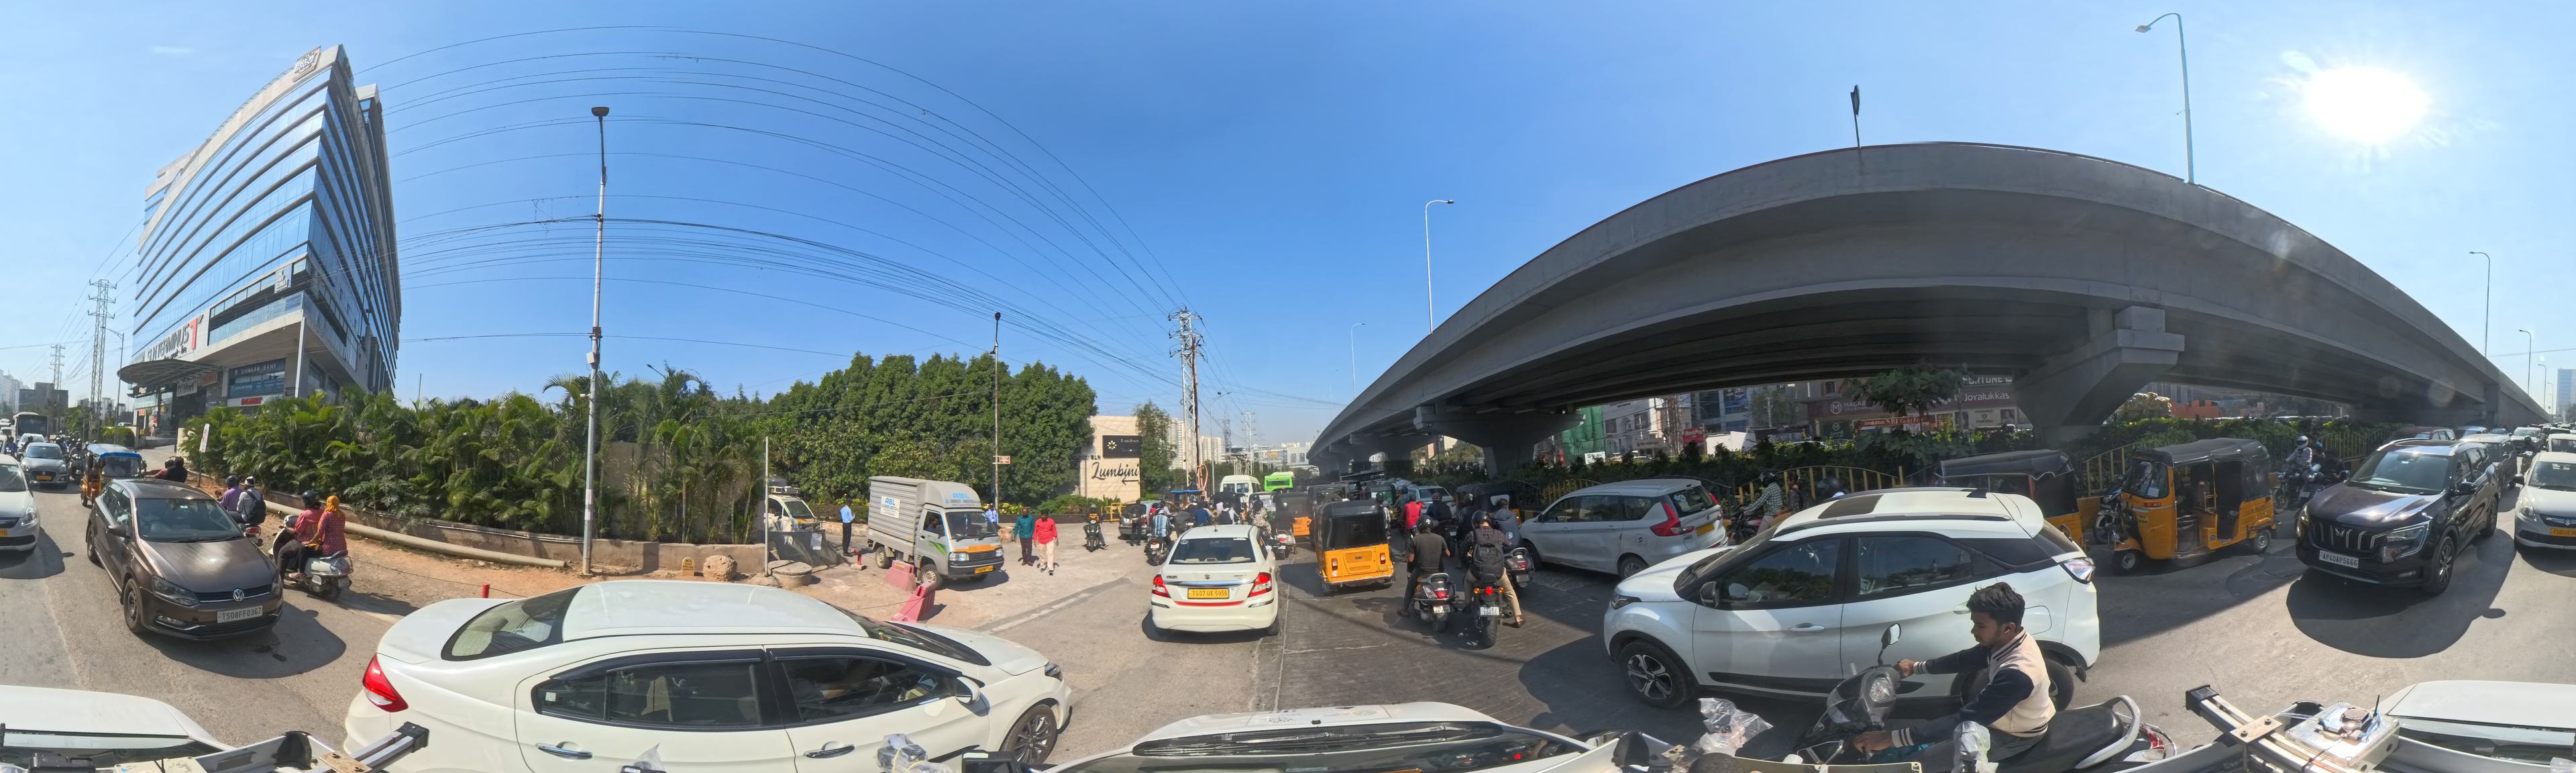
PAN-AQI is the primary resource used for training and evaluation in the paper. It consists of equirectangular panoramic images collected in motion across the Hyderabad-Secunderabad road network, each paired with time-aligned weather and air-quality metadata.

Sample equirectangular panoramic image from PAN-AQI dataset
Sample 360° equirectangular panorama — collected at 3,840 × 1,036 px, resized to 224 × 672 px for model input
Dataset Figures

Data Collection Setup & Dataset Distribution

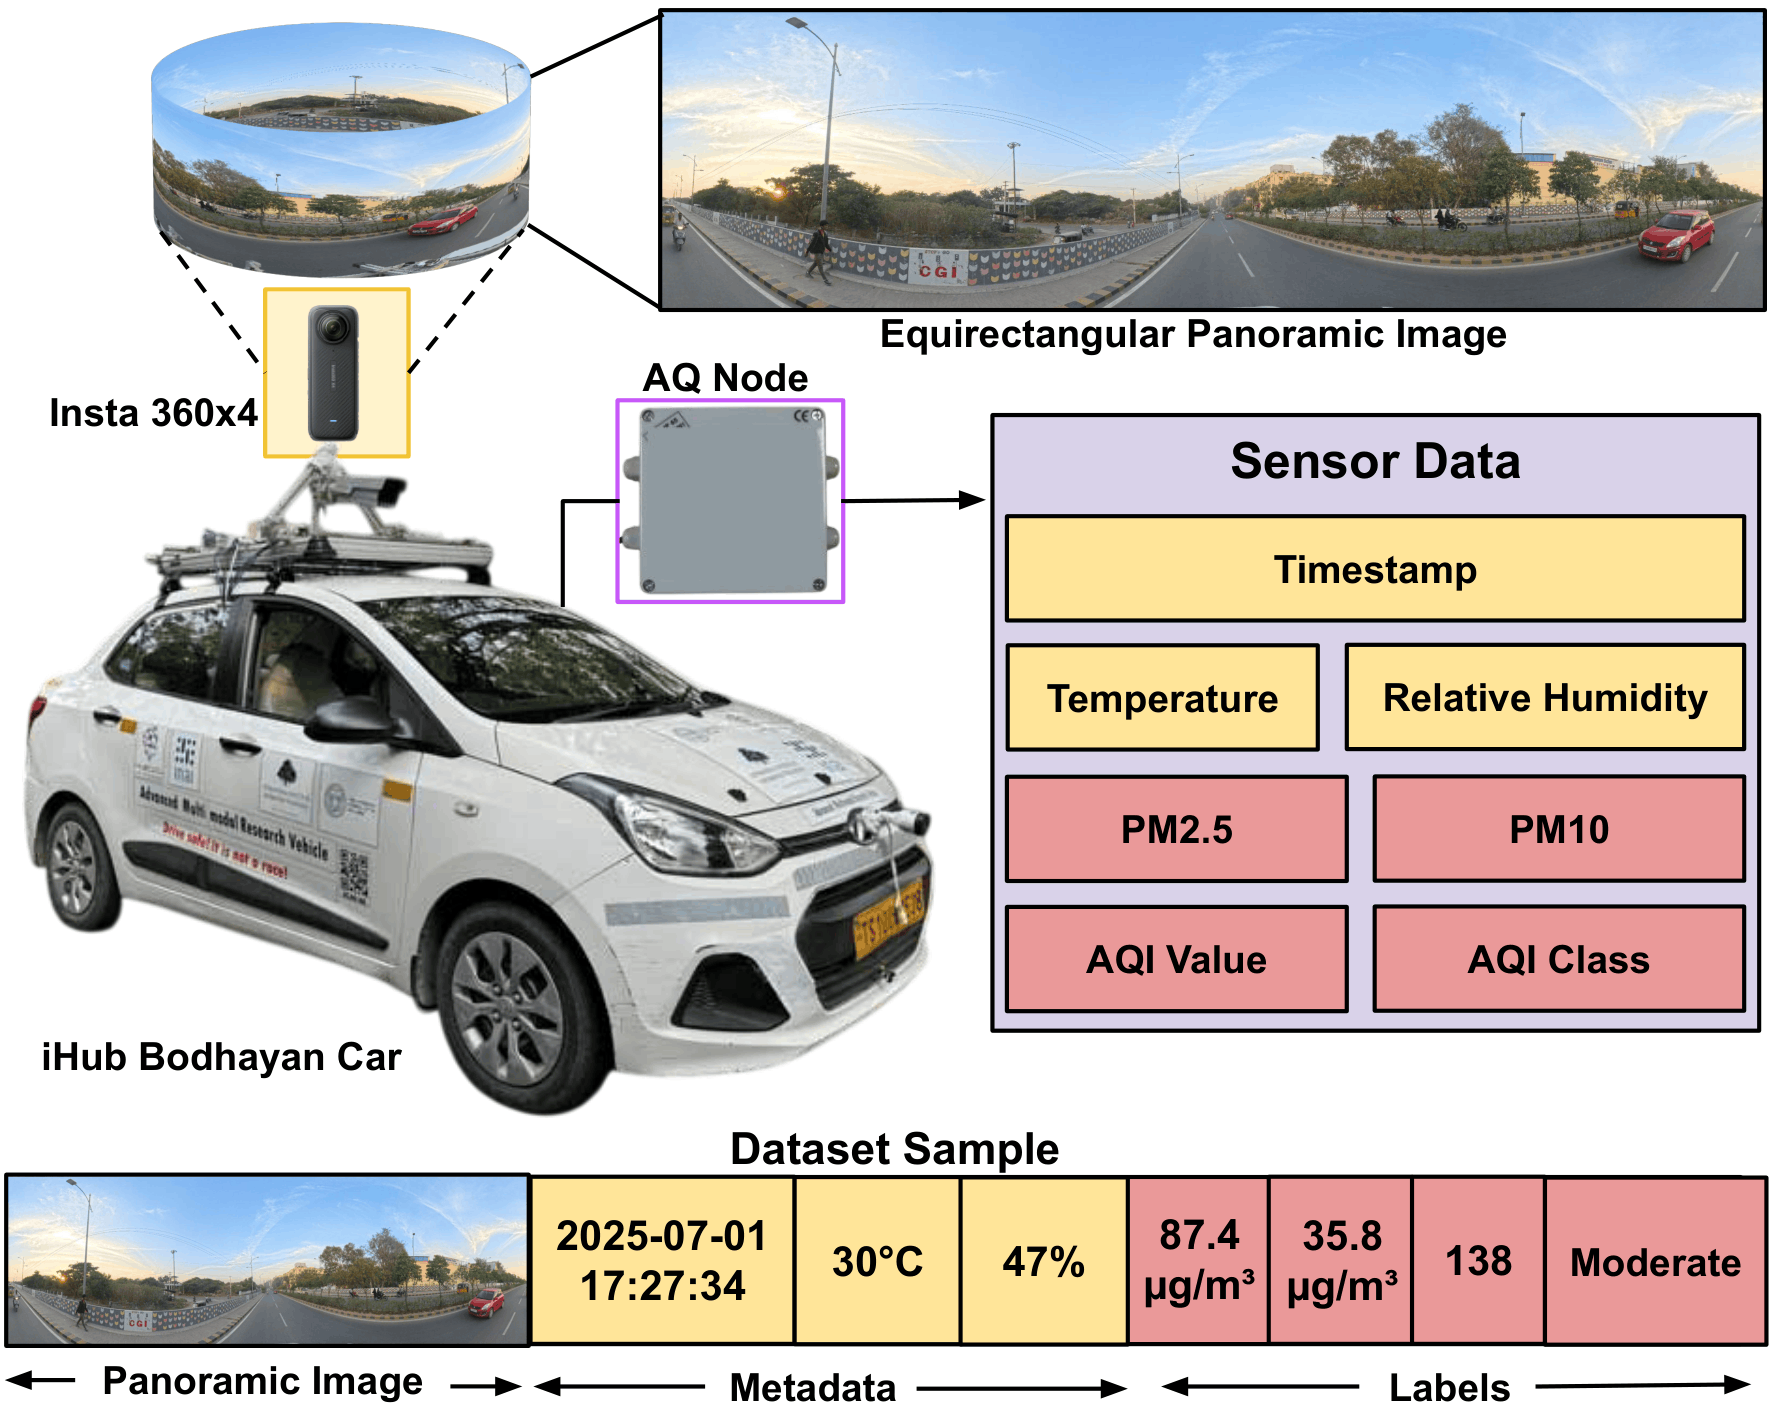
The collection platform combines the iHub Bodhayan electric SUV, a roof-mounted Insta360 X4 panoramic camera at 2.1 m, a Nova SDS011 particulate sensor, an AHT10 temperature-humidity sensor, and an Aeroqual S500 reference unit for validation. The paper reports 23 collection days from December 2024 to August 2025, daytime-only capture, and a seasonal spread of Summer, Monsoon, and Winter samples.

Pre-processing follows the paper’s CPCB-based AQI computation, using the maximum sub-index across PM2.5 and PM10 after spike removal by seasonal 1.5 IQR filtering.

iHub Bodhayan data collection vehicle setup diagram
Data collection setup — Insta360 X4 panoramic camera + Nova SDS011 PM sensor on iHub Bodhayan EV
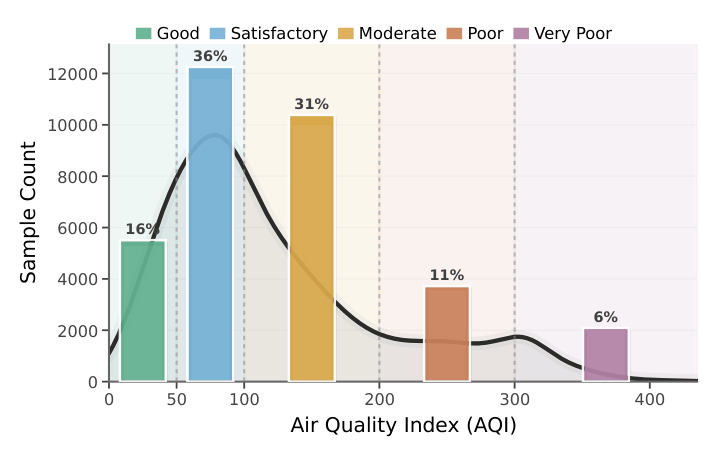
PAN-AQI dataset distribution across AQI bands
AQI class and seasonal distribution across the 33,982-sample corpus

Collection Setup

  • Platform iHub Bodhayan EV (IIIT-H)
  • Camera Insta360 X4 @ 2.1 m height
  • PM sensor Nova SDS011 (1 Hz, UART)
  • Weather AHT10 (temp + humidity)
  • Reference Aeroqual S500 (validation)
  • Resolution 10,560 × 5,280 → 224 × 672 px

Campaign Statistics

  • Total samples 33,982
  • Collection days 23 (Dec 2024 – Aug 2025)
  • Route length ∼1,000 km
  • AQI range 8.4 – 434.7 (median 97.1)
  • Temp range 25.3°C – 57.1°C
  • Humidity 20.6% – 100.0%

Seasonal Distribution

Summer16,292  (47.9%)
Monsoon10,458  (30.8%)
Winter7,232  (21.3%)

Mean AQI: Winter 220.9  ·  Summer 119.0  ·  Monsoon 58.6

AQI Class Distribution

36%
31%
16%
11%
6%
GoodSatisfactoryModeratePoorVP+

5 classes (Severe merged into VP+). Imbalance ratio 5.85×. Inverse-frequency weighting applied in training.

Comparison

How PAN-AQI Compares

Dataset / Method Panoramic Multi-view Co-located PM Multi-season # Samples
Mondal et al.1,818
Liu et al.6,587
Kow et al.3,549
Kalajdjieski et al.1,000
Nilesh et al.5,048
TRAQID (Kathalkar et al.)26,678
PAN-AQI (Ours)33,982

PAN-AQI is the only dataset satisfying all four criteria simultaneously.

Methodology

PANQIFormer Architecture

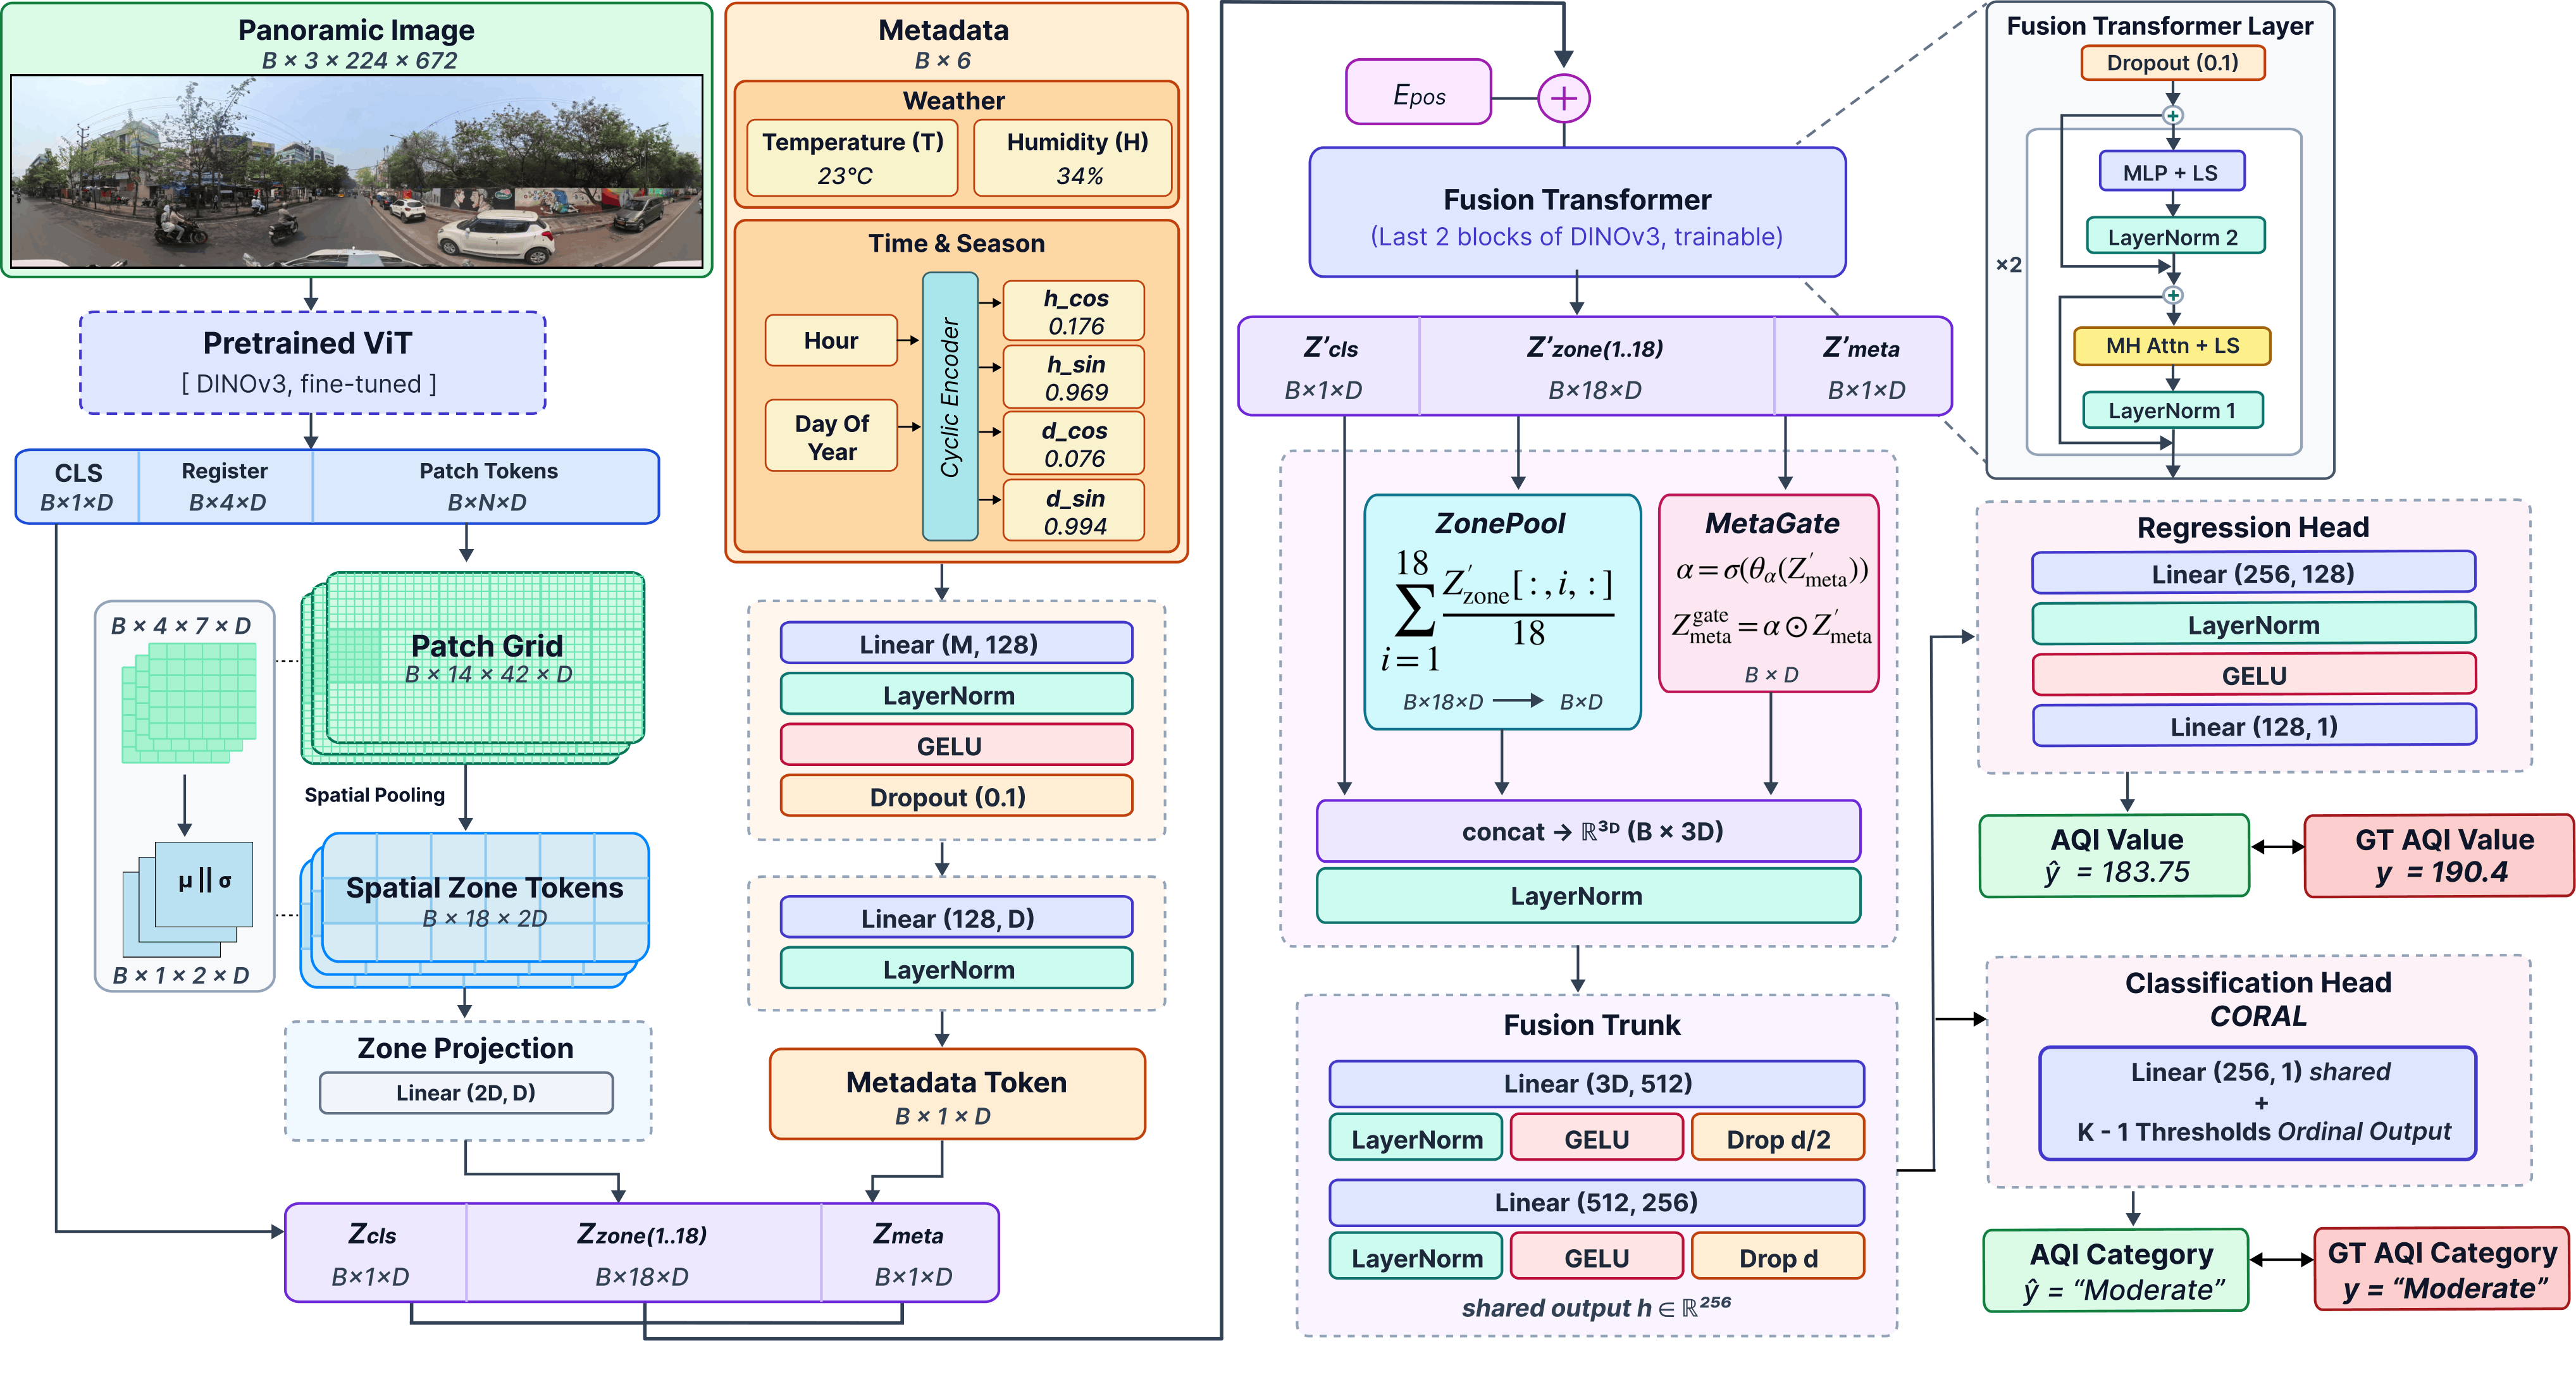
The paper describes PANQIFormer as a three-stage framework: visual encoding with spatial-zone pooling, multimodal fusion via a fusion transformer, and dual prediction heads for AQI regression and classification.

1

Visual Encoding + Spatial Zone Pooling

A DINOv3 ViT-B/16 backbone processes 224 × 672 panoramas into patch embeddings, together with a CLS token and register tokens. The register tokens are discarded, and the remaining patches are grouped into a fixed 6 × 3 spatial layout so the model preserves coarse scene structure across sky, mid-field, and ground regions.

DINOv3 ViT-B/16 6×3 Zone Grid μ ∥ σ pooling
2

Metadata Encoding & Fusion Transformer

Temperature, humidity, and cyclic temporal encodings form the metadata stream. The visual tokens, zone descriptors, and metadata token are jointly processed through the fusion transformer so the model can reason across imagery and sensor context.

Cyclic Encoding MetaGate Cross-modal Attention
3

Shared Trunk + Dual Prediction Heads

The shared latent representation feeds a regression head for continuous AQI estimation and an ordinal classification head for band prediction. The paper reports that this dual-head setup improves both task consistency and overall accuracy.

CORAL Ordinal RPS Loss Smooth L1
PANQIFormer full architecture diagram
Fig. 3 — PANQIFormer architecture: panoramic visual encoder with spatial zone pooling, metadata integration, fusion transformer, and dual-head prediction.
Results

Comparison with Prior Methods

The paper reports that PANQIFormer outperforms the strongest prior method, AQIFormer, by 5.2% in accuracy, 6.1% in macro F1-score, and 11.14 MAE, while also maintaining a 97.4% agreement between its classification and regression heads.

Method Acc ↑ F1 ↑ MAE ↓
Mondal et al.64.062.043.98
Kalajdjieski et al.71.168.432.8
AQC-Net (Zhang et al.)72.061.028.64
Nilesh et al.80.076.027.61
AQIFormer (Kathalkar et al.)83.781.221.59
PANQIFormer (Ours)88.987.310.45
Classification Accuracy
88.9%
▲ +5.2% vs. AQIFormer
Macro F1-Score
87.3%
▲ +6.1% vs. AQIFormer
Regression MAE
10.45
▼ −11.14 vs. AQIFormer
AQI units (scale 0–500)
Head Agreement
97.4%
Classification ↔ Regression consistency
Result Figures

Patch Similarity to CLS Map and UMAP

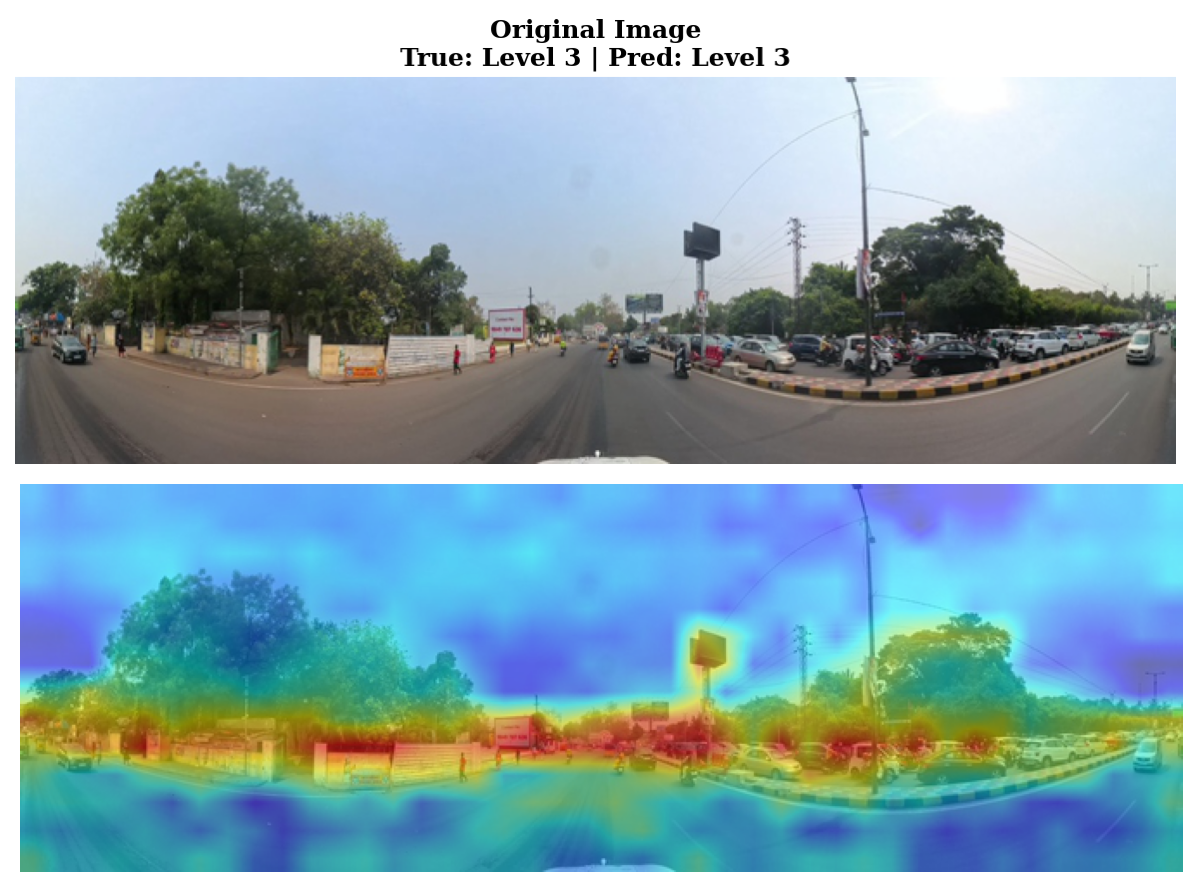
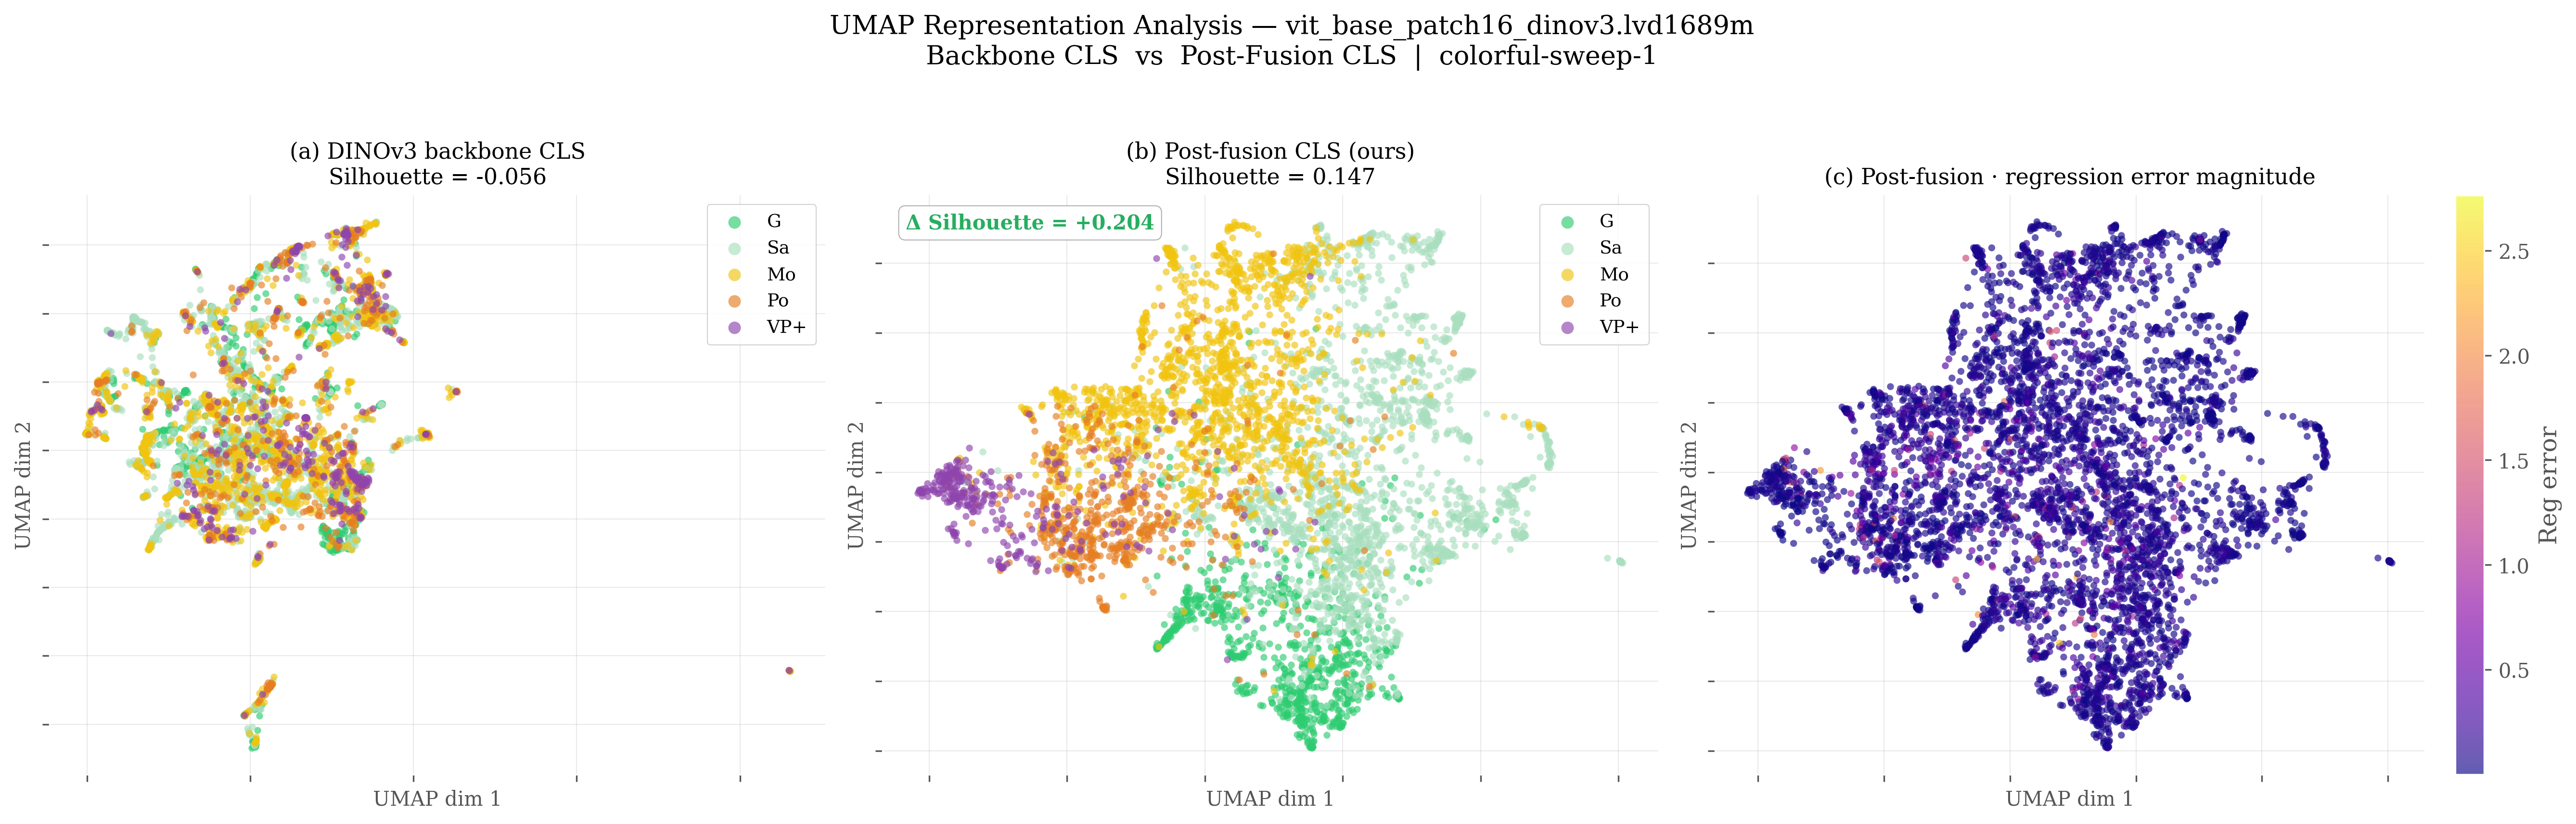
The paper highlights that the learned representation is consistent across heads and visually separable in embedding space, which is why the result figures include both the CLS-map attention view and a UMAP projection of the learned features.

Patch similarity to CLS map from PANQIFormer on panoramic images
Patch similarity to CLS map — PANQIFormer attends to haze, sky discoloration, and vehicular exhaust cues across the full 360° scene
UMAP visualization of PANQIFormer feature space
UMAP projection of learned PANQIFormer embeddings
Ablation Study

Component-wise Contribution Analysis

The ablation study in the paper demonstrates that performance improves monotonically as field of view expands and that the panoramic representation, zone encoding, metadata, and fusion design all contribute measurably to the final scores.

Panoramic Coverage

Single-view (front only)
84.5%
−4.4%
Dual-view (front + rear)
85.9%
−3.0%
Four-view
87.0%
−1.9%
Full Panorama (360°)
88.9%

Performance improves monotonically with FOV. Multi-view aggregation cannot reconstruct the continuous context of a unified panorama.

Architectural Components

ResNet-50 backbone
82.6%
−6.3%
Without zone encoding
84.8%
−4.1%
Concatenation fusion
84.0%
−4.9%
MLP fusion
83.4%
−5.5%
Mean-only zone pooling
87.7%
−1.2%
Without metadata
87.8%
−1.1%
PANQIFormer (full)
88.9%
Conclusion

Summary and Takeaway

The paper concludes that panoramic sensing is a stronger representation for vision-based environmental monitoring than conventional perspective imagery, and that PAN-AQI can serve as a benchmark for future image-driven AQI research.

Main Takeaway

PAN-AQI is presented as the first large-scale panoramic dataset for image-based AQI estimation in India, and PANQIFormer as a multimodal transformer that jointly models panoramic visual context and environmental metadata.

The experimental evidence in the paper indicates that preserving full 360-degree context, adding explicit spatial reasoning, and using attention-based multimodal fusion all materially improve performance.

Limitations and Future Directions

The paper acknowledges that the collection excludes nighttime samples, which is a limitation for generalisation. It points to this gap as a direction for future work alongside broader benchmark use.

The overall message is that panoramic AQI estimation is not just a stronger benchmark setting, but a more faithful modelling choice for urban air-quality monitoring.